Introduction to Technical Analysis in Forex Trading
Timing is everything in the forex market. Even the right idea can fail if your entry or exit is poorly executed. This is where technical analysis in forex trading becomes indispensable.
Technical analysis helps traders interpret price behavior, identify high-probability setups, and manage risk using objective tools. By studying indicators and chart patterns, traders aim to forecast future price movements based on historical data rather than speculation.
In this comprehensive guide, you’ll learn how technical analysis works in forex trading, which indicators matter most, how chart patterns form, and how to combine these tools into a structured, repeatable trading approach.
What Is Technical Analysis in Forex?
Technical analysis in forex trading is the study of price movements using charts, indicators, and patterns to predict future market behavior. Instead of focusing on economic news or central bank policy, technical traders analyze:
-
Price action
-
Historical market data
-
Trends and momentum
-
Support and resistance levels
The underlying assumption is simple: price reflects all available information, and market behavior tends to repeat over time.
Why Technical Analysis Matters for Forex Traders
Forex markets are fast-moving and highly liquid. As a result, price action often reacts instantly to new information. Technical analysis offers several advantages:
-
Objective decision-making based on data, not emotion
-
Clear entry and exit signals
-
Adaptability across timeframes and currency pairs
-
Scalability for day traders, swing traders, and position traders
Moreover, technical analysis supports both discretionary and systematic trading strategies.
Core Principles Behind Technical Analysis
Before diving into indicators and chart patterns, it’s essential to understand the foundational principles.
1. The Market Discounts Everything
All known information—economic, political, and psychological—is already reflected in price.
2. Price Moves in Trends
Forex markets often move in identifiable trends: uptrends, downtrends, or ranges.
3. History Tends to Repeat Itself
Human behavior creates recurring patterns that appear on price charts.
These principles form the backbone of all technical analysis methods.
Understanding Forex Charts and Timeframes
Forex technical analysis begins with charts. The most commonly used types include:
-
Line charts – Simple and clean, but limited
-
Bar charts – Show open, high, low, and close
-
Candlestick charts – Most popular due to visual clarity
Choosing the Right Timeframe
Timeframe selection depends on your trading style:
-
Scalping: 1–5 minute charts
-
Day trading: 15-minute to 1-hour charts
-
Swing trading: 4-hour and daily charts
-
Position trading: Daily to weekly charts
Higher timeframes generally provide more reliable signals.
Candlestick Patterns Every Forex Trader Should Know

Candlestick patterns reveal short-term shifts in market sentiment.
Key Single-Candle Patterns
-
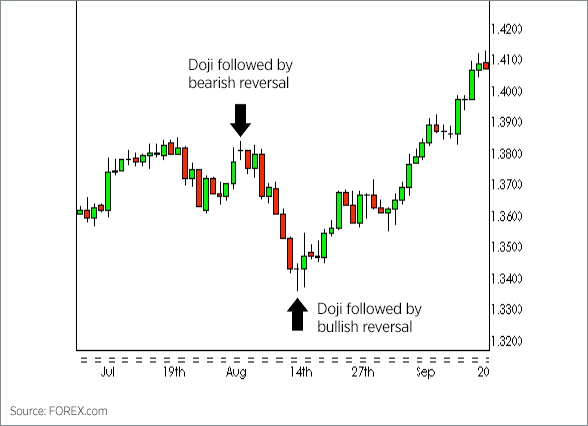
Doji: Market indecision
-
Hammer: Potential bullish reversal
-
Shooting Star: Potential bearish reversal
Multi-Candle Patterns
-
Bullish Engulfing: Strong buying pressure
-
Bearish Engulfing: Strong selling pressure
-
Morning Star: Trend reversal to the upside
-
Evening Star: Trend reversal to the downside
These patterns work best when aligned with trend direction and key price levels.
Major Forex Chart Patterns and Their Meanings


Chart patterns represent market structure and psychology over time.
Reversal Patterns
-
Head and Shoulders: Trend exhaustion
-
Inverse Head and Shoulders: Bullish reversal
-
Double Top / Double Bottom: Failed continuation
Continuation Patterns
-
Flags and Pennants: Brief consolidation
-
Ascending and Descending Triangles: Breakout potential
-
Rectangles: Range-bound accumulation
Pattern confirmation through volume and indicators increases reliability.
Technical Indicators in Forex Trading Explained
Technical indicators are mathematical calculations applied to price or volume data. They help traders confirm trends, momentum, and potential reversals.
Indicators fall into four main categories:
-
Trend indicators
-
Momentum indicators
-
Volatility indicators
-
Volume indicators
Trend Indicators: Identifying Market Direction
Trend indicators help traders stay aligned with the dominant market direction.
Moving Averages
-
Simple Moving Average (SMA)
-
Exponential Moving Average (EMA)
Uses:
-
Trend identification
-
Dynamic support and resistance
-
Crossover strategies
Average Directional Index (ADX)
-
Measures trend strength
-
Values above 25 indicate strong trends
Momentum Indicators: Measuring Strength and Speed
Momentum indicators show how fast price is moving and whether it’s overextended.
Relative Strength Index (RSI)
-
Range: 0–100
-
Overbought above 70
-
Oversold below 30
Moving Average Convergence Divergence (MACD)
-
Tracks momentum shifts
-
Signal line crossovers suggest entries
Momentum indicators are ideal for spotting divergence and early reversals.
Volatility Indicators: Timing Market Expansion
Volatility indicators help traders anticipate breakouts.
Bollinger Bands
-
Measure price deviation from the mean
-
Narrow bands signal low volatility
-
Expanding bands indicate potential breakouts
Average True Range (ATR)
-
Measures market volatility
-
Useful for setting stop-loss levels
Volume and Market Participation Indicators
Although spot forex lacks centralized volume, tick volume provides valuable insights.
Common Volume-Based Tools
-
On-Balance Volume (OBV)
-
Volume Oscillator
Rising volume during breakouts adds confirmation to technical setups.
How to Combine Indicators and Chart Patterns
Successful technical analysis in forex trading relies on confluence, not single signals.
Example Strategy Framework
-
Identify the trend using moving averages
-
Mark key support and resistance zones
-
Wait for a chart pattern near a level
-
Confirm with RSI or MACD
-
Manage risk using ATR-based stops
Using multiple tools reduces false signals and improves consistency.
Common Technical Analysis Mistakes to Avoid
Many traders struggle not because technical analysis fails, but because it’s misused.
Avoid these pitfalls:
-
Overloading charts with indicators
-
Ignoring higher timeframes
-
Trading every signal without confirmation
-
Neglecting risk management
Simplicity and discipline outperform complexity.
Technical Analysis vs Fundamental Analysis in Forex
Both approaches serve different purposes.
| Technical Analysis | Fundamental Analysis |
|---|---|
| Focuses on price | Focuses on economic data |
| Short- to medium-term | Medium- to long-term |
| Timing entries | Explaining market moves |
Many professional traders use a hybrid approach, combining fundamentals for bias and technicals for execution.
Best Practices for Applying Technical Analysis
To maximize results:
-
Backtest every strategy
-
Keep a detailed trading journal
-
Focus on a few indicators you understand well
-
Trade with the trend whenever possible
-
Use proper position sizing
Consistency comes from process, not prediction.
Frequently Asked Questions (FAQ)
1. Is technical analysis effective in forex trading?
Yes. When applied correctly, technical analysis helps traders identify high-probability setups and manage risk effectively.
2. Which indicator is best for forex trading?
There is no single best indicator. RSI, moving averages, and MACD are popular due to their versatility.
3. Can beginners use technical analysis?
Absolutely. Beginners should start with basic chart patterns and one or two indicators.
4. How many indicators should I use?
Typically, two to four well-chosen indicators are sufficient.
5. Does technical analysis work on all currency pairs?
Yes, especially on highly liquid pairs like EUR/USD, GBP/USD, and USD/JPY.
6. Is technical analysis better for day trading or swing trading?
It works for both, provided the timeframe and strategy are aligned.
Conclusion: Mastering Technical Analysis in Forex Trading
Technical analysis in forex trading is not about predicting the future with certainty. Instead, it’s about stacking probabilities in your favor using structured tools, disciplined execution, and sound risk management.
By understanding indicators, recognizing chart patterns, and applying them within a consistent framework, traders gain clarity and confidence in fast-moving markets.
If you’re serious about improving your forex performance, start refining your technical analysis skills today—because in trading, precision beats prediction every time.