Fibonacci retracement is one of the most powerful technical analysis tools used by Forex traders to identify potential support and resistance levels and anticipate price reversals. Rooted in a mathematical sequence developed by 13th-century mathematician Leonardo Fibonacci, this tool has become a cornerstone of modern Forex trading.
In this article, we explore Fibonacci retracement in depth—how it works, how to apply it effectively, advanced techniques, common mistakes, and real-world trading examples to help you use Fibonacci retracement with confidence.
Introduction to Fibonacci Retracement
Fibonacci retracement is a technical analysis tool used to identify potential reversal levels in the price movement of a financial asset. It is based on the idea that markets often retrace a predictable portion of a price move before continuing in the original direction.
Forex traders use Fibonacci retracement levels to locate possible support and resistance zones, helping them determine optimal entry and exit points. Because it can be applied across multiple timeframes, Fibonacci retracement is especially popular in Forex trading.

The Fibonacci Sequence and Its Relevance to Trading
Understanding the Fibonacci Sequence
The Fibonacci sequence begins with 0 and 1, with each subsequent number being the sum of the two preceding numbers:
0, 1, 1, 2, 3, 5, 8, 13, 21, 34, …
The importance of this sequence lies in the mathematical ratios derived from it, which frequently appear in nature, financial markets, and price behavior.
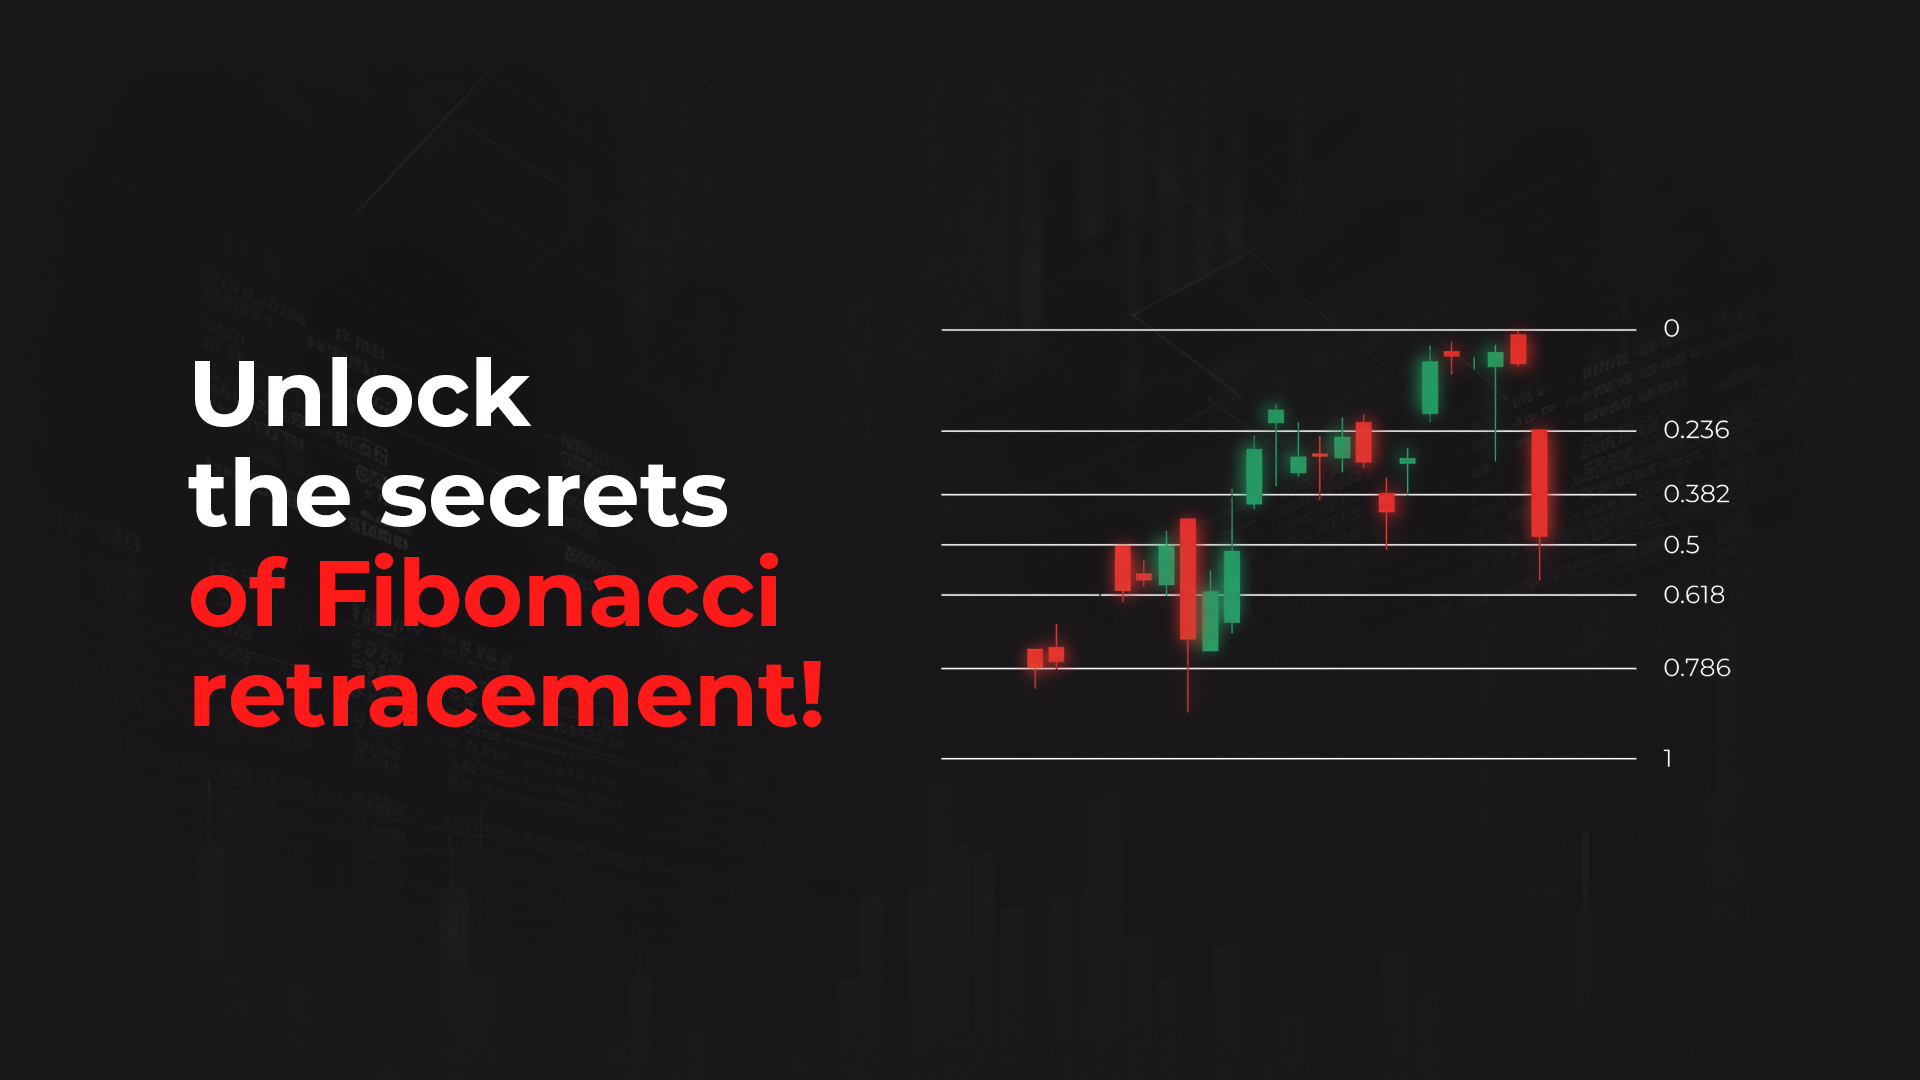
Fibonacci Ratios and Their Importance
The most commonly used Fibonacci retracement levels in trading are:
-
23.6%
-
38.2%
-
50%
-
61.8%
-
78.6%
Key Levels Explained
-
38.2% and 61.8%: Among the most significant levels. The 61.8% level, known as the golden ratio, often acts as strong support or resistance.
-
23.6% and 78.6%: Used to measure shallow and deep retracements.
-
50%: Although not a true Fibonacci ratio, it is widely used in technical analysis as a key retracement level.
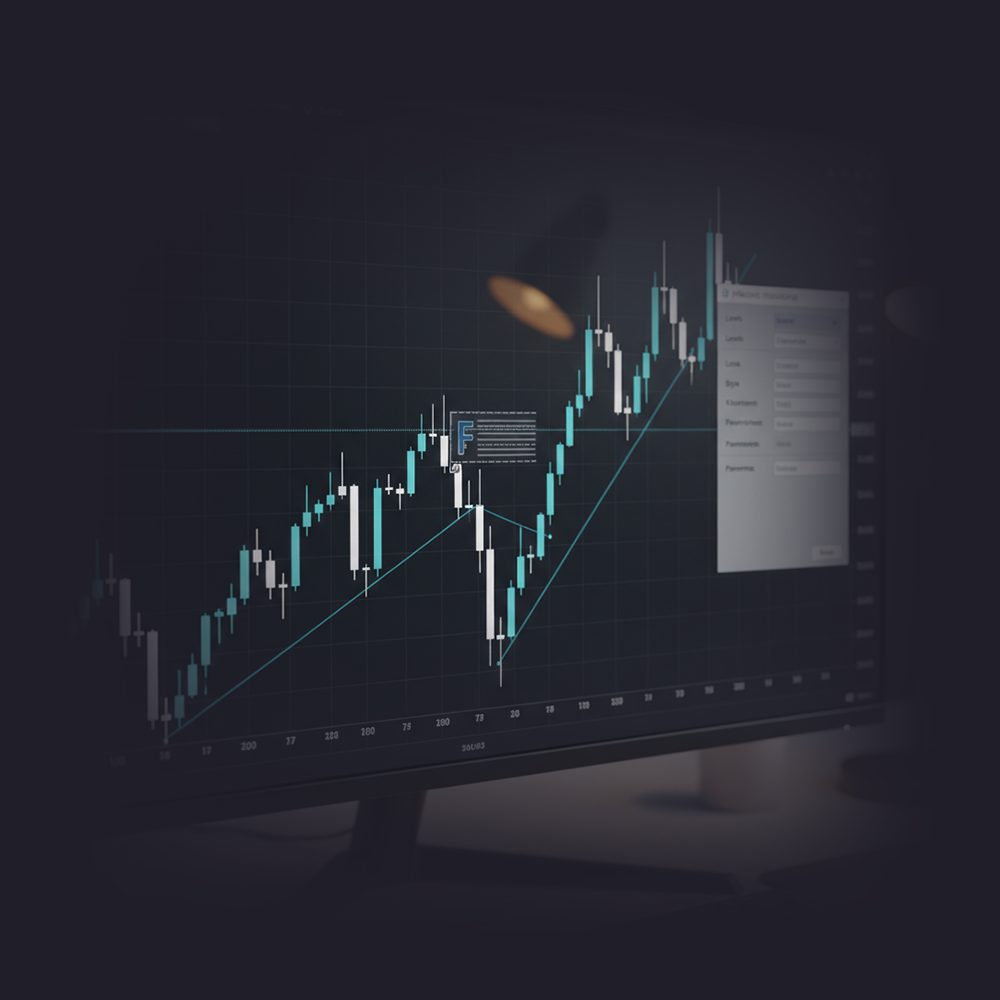
How to Draw and Interpret Fibonacci Retracement Levels
Correctly drawing Fibonacci retracement levels is essential for accurate analysis.
How to Draw Fibonacci Retracement on a Chart
To apply Fibonacci retracement:
-
Identify a clear swing high and swing low.
-
In an uptrend, draw the tool from the swing low to the swing high.
-
In a downtrend, draw from the swing high to the swing low.
Example:
If a currency pair rises from 1.1000 to 1.1500, draw the Fibonacci retracement from 1.1000 (low) to 1.1500 (high) to identify potential retracement levels.
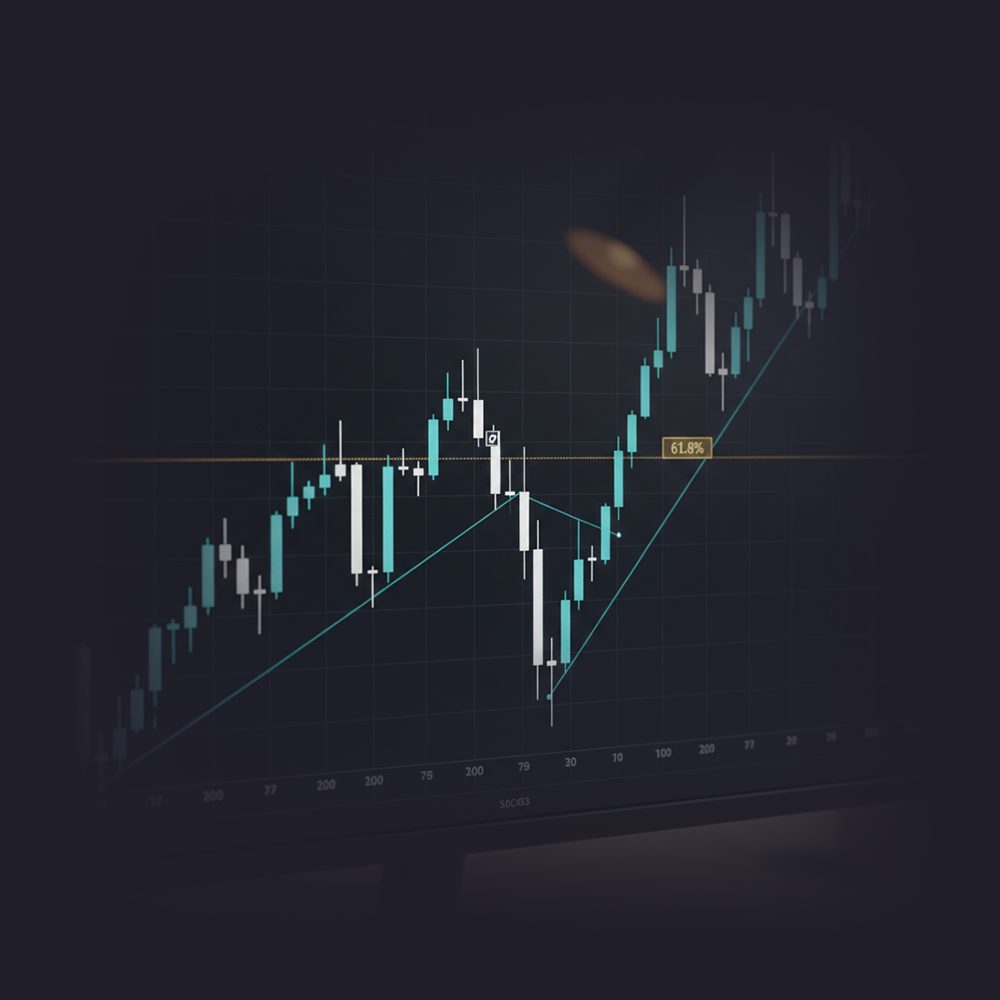
Key Fibonacci Levels Explained
Once plotted, Fibonacci retracement displays horizontal lines at key levels:
-
38.2%: Indicates a shallow pullback and a strong trend
-
50%: Represents an average retracement
-
61.8%: Often provides strong support or resistance
Price Action Around Fibonacci Levels
When price approaches a Fibonacci level, traders watch closely for confirmation signals such as candlestick patterns or indicator alignment.
Example:
If EUR/USD retraces to the 61.8% level after a strong uptrend and forms a bullish candlestick pattern, this may signal a continuation of the trend and a potential buying opportunity.
Using Fibonacci Retracement in Forex Trading
Fibonacci retracement helps traders refine entries, exits, and risk management strategies.
Identifying Potential Entry and Exit Points
Many traders enter trades at Fibonacci levels when confirmed by price action or other indicators.
Example:
A GBP/USD trader enters a long position at the 50% retracement level after price shows signs of resuming the uptrend.
Combining Fibonacci Retracement with Other Indicators
Fibonacci retracement is most effective when combined with other technical tools such as:
-
Moving averages
-
RSI (Relative Strength Index)
-
MACD
Example:
If the 50% retracement level aligns with moving average support and RSI shows oversold conditions, it strengthens the case for a trade entry.

Fibonacci-Based Trading Strategies
Trend-Following Strategy
Use Fibonacci retracement to enter trades in the direction of the main trend after a pullback—commonly at the 38.2% or 50% levels.
Reversal Strategy
Deeper retracements, such as the 61.8% level, may signal potential reversals when combined with strong confirmation.
Advanced Fibonacci Retracement Techniques
Fibonacci Extensions and Expansions
Fibonacci extensions project potential profit targets beyond the original price move.
Example:
After a retracement to 61.8%, a trader may use the 161.8% extension as a take-profit target.
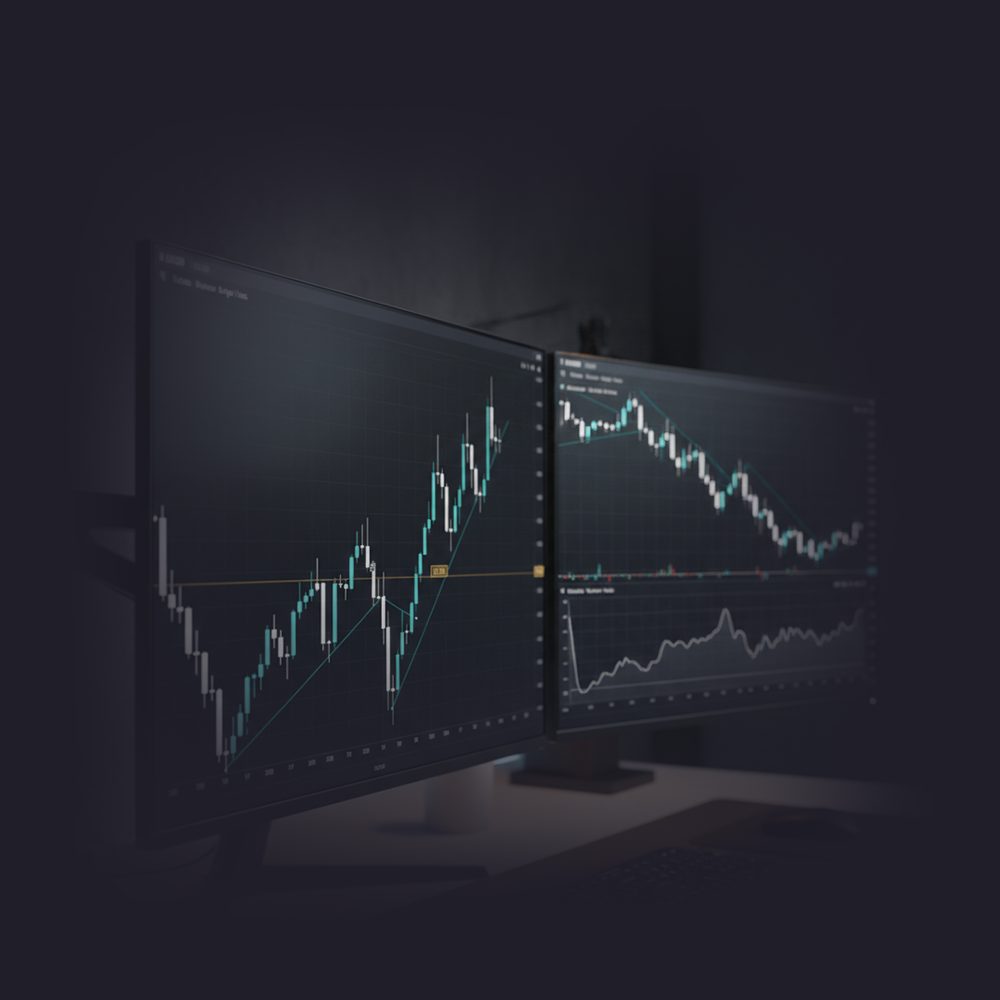
Multi-Timeframe Fibonacci Analysis
Analyzing Fibonacci levels across multiple timeframes helps identify stronger support and resistance zones.
Example:
A Fibonacci level on the daily chart confirmed on the 4-hour chart offers higher-probability trade setups.
Combining Fibonacci Retracement with Elliott Wave Theory
Fibonacci retracement works exceptionally well with Elliott Wave Theory, as corrective waves often retrace Fibonacci percentages of impulse waves.
Example:
A corrective wave retracing 38.2% of the previous impulse wave may confirm the start of a new trend leg.
Common Mistakes to Avoid When Using Fibonacci Retracement
Over-Reliance on Fibonacci Levels
Using Fibonacci retracement alone can lead to poor decisions.
Tip:
Always confirm Fibonacci levels with other indicators and broader market analysis.
Incorrect Identification of Swing Highs and Lows
Misplaced swing points lead to inaccurate retracement levels.
Tip:
Use higher timeframes to validate key swing highs and lows.
Ignoring Market Context
Fibonacci levels must be interpreted within overall market conditions such as trend direction, volatility, and fundamentals.
Tip:
Avoid trading against strong trends based solely on Fibonacci retracement levels.
Case Studies: Successful Trades Using Fibonacci Retracement
Case Study 1: EUR/USD Swing Trade
A trader identified a strong uptrend in EUR/USD. Price retraced to the 50% level and showed bullish confirmation. A long trade was entered, targeting the previous swing high, resulting in a profitable trade.
Case Study 2: GBP/JPY Day Trading Strategy
During a volatile session, a trader identified a downtrend in GBP/JPY. Price retraced to the 61.8% level, which aligned with resistance. A short position was entered, and the trade closed in profit as the trend resumed.
Conclusion: Mastering Fibonacci Retracement for Forex Success
Fibonacci retracement is a valuable tool for identifying potential support, prove resistance, and trend continuation zones in Forex trading. When applied correctly and combined with other forms of analysis, it can significantly enhance decision-making and trading performance.
No single tool guarantees success, but mastering Fibonacci retracement as part of a balanced trading strategy can help traders achieve more consistent and confident results in the Forex market.
Frequently Asked Questions (FAQs)
What is Fibonacci retracement in Forex trading?
Fibonacci retracement is a technical analysis tool used to identify potential support and resistance levels in the Forex market. It is based on key percentages derived from the Fibonacci sequence and helps traders anticipate possible price reversals or trend continuations.
Which Fibonacci retracement levels are the most important?
The most commonly used Fibonacci retracement levels are 38.2%, 50%, and 61.8%. Among them, 61.8%, known as the golden ratio, is considered the most significant due to its strong influence on price behavior.
How do you correctly draw Fibonacci retracement levels?
To draw Fibonacci retracement levels:
-
Identify a clear swing high and swing low
-
In an uptrend, draw from the swing low to the swing high
-
In a downtrend, draw from the swing high to the swing low
Correct swing point selection is crucial for accurate analysis.
Does Fibonacci retracement work in all market conditions?
Fibonacci retracement works best in trending markets. In ranging or highly choppy markets, Fibonacci levels may be less reliable and should be combined with other indicators and price action confirmation.
Can Fibonacci retracement be used for day trading?
Yes, Fibonacci retracement is commonly used by day traders, swing traders, and long-term traders. The key is choosing the correct timeframe and confirming Fibonacci levels with lower-timeframe price action.
Is Fibonacci retracement reliable on its own?
No. Fibonacci retracement should not be used as a standalone tool. It is most effective when combined with other technical indicators such as moving averages, RSI, MACD, trendlines, or candlestick patterns.
What is the difference between Fibonacci retracement and Fibonacci extension?
Fibonacci retracement identifies potential pullback levels, while Fibonacci extension is used to project profit targets beyond the current price move, such as the 127.2% or 161.8% levels.
How accurate is Fibonacci retracement in Forex trading?
Fibonacci retracement is not about precision but probability. Its accuracy improves significantly when multiple technical factors align at the same Fibonacci level, creating confluence zones.
Can beginners use Fibonacci retracement effectively?
Yes. Fibonacci retracement is beginner-friendly, but it requires practice. Beginners should start by using it on higher timeframes and combine it with basic trend analysis and strict risk management.
What is the biggest mistake traders make with Fibonacci retracement?
The most common mistake is forcing Fibonacci levels onto charts or relying on them without confirmation. Misidentifying swing points and ignoring market context are also frequent errors.
Does Fibonacci retracement work in Forex better than stocks or crypto?
Fibonacci retracement works well across Forex, stocks, indices, and crypto markets. However, Forex markets often respect Fibonacci levels more consistently due to high liquidity and strong technical behavior.
How can I improve my results using Fibonacci retracement?
You can improve results by:
-
Trading in the direction of the main trend
-
Waiting for price action confirmation
-
Using multiple timeframes
-
Applying proper risk management