
Candlestick patterns have become one of the most demanded and reliable tools applied by both Forex and stock traders around the world for a better way of market interpretation and fruitful trading. This article will focus on some basic candlestick patterns, their importance, and some indispensable ones that every trader should know.
Candlestick Basics Explained
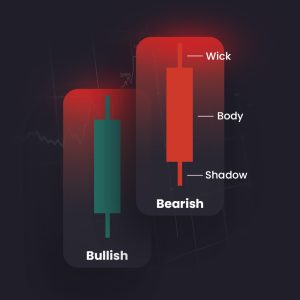
A candlestick is a form of a chart used within technical analysis, representing the price movement of an asset. It displays the open, high, low, and close of the price over a period of time. The body of the candle makes the price bar between the opening and closing prices, while the wicks or shadows are the highest and lowest prices in that period.
Bullish Candlestick:
If the closing price is higher than the opening price, then the candlestick is almost always filled or colored green, representing a bullish move in the market.
Bearish Candlestick:
In contrast, when the close is less than the open, a candlestick is typically filled in or shown as red in color. This represents a bearish market trend.
Why Candlestick Patterns Matter
All that candlestick patterns do is reveal the market’s psychology. Traders can predict price movements from such patterns. All these enable the trader to identify reversal points, possible continuation signals, and trend confirmations. In that sense, candlestick patterns become very powerful in strategies for both Forex and stock trading.
Key Candlestick Patterns Every Trader Should Know
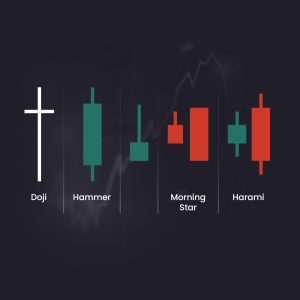
Doji candlestick:
The open and close prices have to be almost the same. It has a small body but with relatively longer wicks and, hence, brings out the notion of indecision in the market. The prior price action will determine whether the Dojis will provide a signal for a potential reversal or continuation.
Gravestone Doji:
Implies a bearish reversal.
Dragonfly Doji:
It is a bullish reversal indication.
Long-legged Doji:
This signals strong indecision and typically occurs right before a breakout.
Hammer and Hanging Man:
The Hammer and Hanging Man look identical but have very different meanings, depending on where they occur in the trend.
Hammer:
A bullish reversal pattern that can form after a decline. It consists of a smallish body and a long lower wick. It suggests that sellers have tried to push the price lower during the session, but eventually, the buyers fought back these attempts, making prices rise from their lows to a certain extent.
Hanging Man:
This is a pattern of bearish reversal that succeeds during an uptrend. It has a small body with a long wick at the bottom. This shows that the buying pressure outweighs the selling pressure.
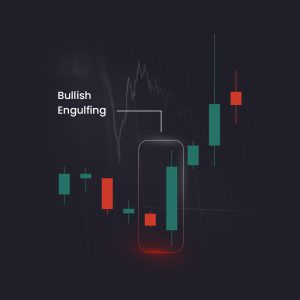
Engulfing Patterns:
Engulfing patterns are composed of two candlesticks, with the second one that totally engulfs the body of the first.
Bullish Engulfing:
Occurs following a downtrend, which informs of the probable reversal. The second candlestick opens at a price lower than the closing price the day before but closes at a price higher than the opening price the day prior, so extremely indicative of very strong buying pressure.
Bearish Engulfing:
This appears in an uptrend and signals that there could be a reversal of that trend. The second candlestick opens much higher than the previous day’s open but closes at a significantly lower level due to serious selling pressure.
Morning Star and Evening Star:
The Morning Star and Evening Star are three-stick patterns that will indicate a potential reversal is forthcoming.
Morning Star:
It is a bullish reversal pattern that comes following a fall and involves a large bearish candle, a candle of reduced body size, which can be either bearish or bullish, and a large bullish candle. It has the implication that selling momentum has been weakening and buyers have started to get into control.
Evening Star:
A bearish reversal pattern seen in an uptrend, which opens with a large bullish candle, followed by a small-bodied candle and concludes with a large bearish candle. The pattern identifies that buying momentum is waning, while selling momentum is gaining strength.
Harami Patterns:
The Harami patterns are two-candlestick formations that suggest reversals may be about to occur.
Bullish Harami:
This is also established in a downtrend. It is composed of one large bearish candle and a small bullish candle that’s totally engulfed in the body of the first prior bearish candle. This is a clear indication that the market may likely reverse.
Bearish Harami:
This is found in an uptrend. A large bullish candle must be followed by a small bearish one within the body of the first candle. Reversal to the downside.
Three White Soldiers and Three Black Crows:
These are good indicators for indicating a continuation or the end of a trend.
Three White Soldiers:
A bullish continuation pattern that comes out with three consecutive small wick bullish candles. This is a solid sign of buying pressure and there being a good probability that more upward movement could come.
Three Black Crows:
This is a bearish reversal pattern made up of three long bearish candles, one after another, with very short wicks. It indicates heavy selling and that prices are highly likely to continue declining.
Incorporating Candlestick Patterns into Your Strategy
As informative as they are, candlestick patterns should be used in association with other tools of analysis. The best traders often substantiate their predictions by analyzing these candlestick patterns along with other indicators of technical analysis such as moving averages, RSI (Relative Strength Index), and support and resistance levels.
For example, a Bullish Engulfing emerging at an important support level would serve as a stronger buy signal than the pattern by itself. Similarly, a Bearish Harami at a level of resistance could suggest that the probability of a market decline was higher.
Common candlestick Mistakes to Avoid
Relying too much on patterns:
Even though patterns are helpful, you should not wholly rely on them. It is very important to look at the general market condition for making a trade instead of fully relying on these patterns.
Ignoring Volume:
Perhaps the greatest clue to determining whether the power behind a candlestick formation is confirmed lies in the volume. Without high trading volume, perhaps the pattern does not end up being very significant after all.
Absence of Patience:
Candlestick patterns work best on higher time frames. Getting over-reliant on lower time frames can lead to an abundance of false signals for the trader and, therefore, can maybe lead to bad trading decisions.
Conclusion
Candlestick patterns serve as a necessity in any Forex or stock trader’s arsenal. By getting the clear picture of what the pattern in the charts represents and means, traders can analyze the market trend and act accordingly. The trader should consider the big picture and employ other technical analysis
methods in their approach. Keep an eye out for these patterns as you are refining your strategy and practice how to analyze them in various market conditions. You will eventually get to have an intuition of how to use the candlestick pattern properly with your trading st
Do candlestick patterns work in Forex and Crypto?
Yes. Candlestick psychology works across all markets.
What is the most reliable candlestick pattern?
Engulfing patterns and Morning/Evening Stars are among the strongest.
Do candlestick patterns guarantee profit?
No pattern is 100% accurate. Use proper risk management.